회귀 문제(regression problem)의 목표는 연속 출력값을 예측하는 것 입니다. 클래스 목록에서 클래스를 선택하는 것이 목표입니다. (사진을 인식해 사과 인지 오렌지를 식별함).
이 노트 북은 고전적인 Auto MPG 데이터셋을 사용하여 모델을 만들고 있는 1970년대 후반부터 1980년데 전반까지의 자동차 연비 예측을 수행합니다. 이를 수행할 목적으로, 저 시기동안 많은 자동차들의 설명(description)을 가지고 구축한 모델을 제공합니다. 이 설명은 다음의 속성을 포함합니다. 예) 실린더, 변위(displacement), 마력(horsepower), 무게
이 예제는 tf.keras API를 사용합니다. 자세한 가이드를 보시면 this guide 글을 보세요.
# Use seaborn for pairplot
!pip install -q seaborn

# Use some functions from tensorflow_docs
!pip install -q git+https://github.com/tensorflow/docs
from __future__ import absolute_import, division, print_function, unicode_literals

import pathlib

import matplotlib.pyplot as plt
import numpy as np
import pandas as pd
import seaborn as sns
import tensorflow as tf

from tensorflow import keras
from tensorflow.keras import layers

print(tf.__version__)
2.0.0
import tensorflow_docs as tfdocs
import tensorflow_docs.plots
import tensorflow_docs.modeling
오토 MPG 데이터셋
데이터셋은 UCI Machine Learning Repository에서 이용할 수 있습니다.
Get the data
첫번째로 데이터 셋을 다운로드합니다.
dataset_path = keras.utils.get_file("auto-mpg.data", "http://archive.ics.uci.edu/ml/machine-learning-databases/auto-mpg/auto-mpg.data")
dataset_path
Downloading data from http://archive.ics.uci.edu/ml/machine-learning-databases/auto-mpg/auto-mpg.data
32768/30286 [================================] - 0s 1us/step

'/home/kbuilder/.keras/datasets/auto-mpg.data'
pandas를 임포트합니다.
column_names = ['MPG','Cylinders','Displacement','Horsepower','Weight',
                'Acceleration', 'Model Year', 'Origin']
raw_dataset = pd.read_csv(dataset_path, names=column_names,
                      na_values = "?", comment='\t',
                      sep=" ", skipinitialspace=True)

dataset = raw_dataset.copy()
dataset.tail()
데이터 청소
데이터셋에 몇개의 무명 값들이 들어 있습니다.
dataset.isna().sum()
MPG             0
Cylinders       0
Displacement    0
Horsepower      6
Weight          0
Acceleration    0
Model Year      0
Origin          0
dtype: int64
이 초기 튜토리얼을 유지하려면 해당 행을 삭제합니다.
dataset = dataset.dropna()
"Origin" 칼럼은 카테고리며 숫자가 아닙니다. one-hot으로 변환하겠습니다.
dataset['Origin'] = dataset['Origin'].map(lambda x: {1: 'USA', 2: 'Europe', 3: 'Japan'}.get(x))
dataset = pd.get_dummies(dataset, prefix='', prefix_sep='')
dataset.tail()
학습과 테스트로 데이터로 나누기
학습셋과 테스트셋으로 나누겠습니다. 테스트 셋은 우리 모델의 최종 평가에 이용합니다.
train_dataset = dataset.sample(frac=0.8,random_state=0)
test_dataset = dataset.drop(train_dataset.index)
데이터 조사
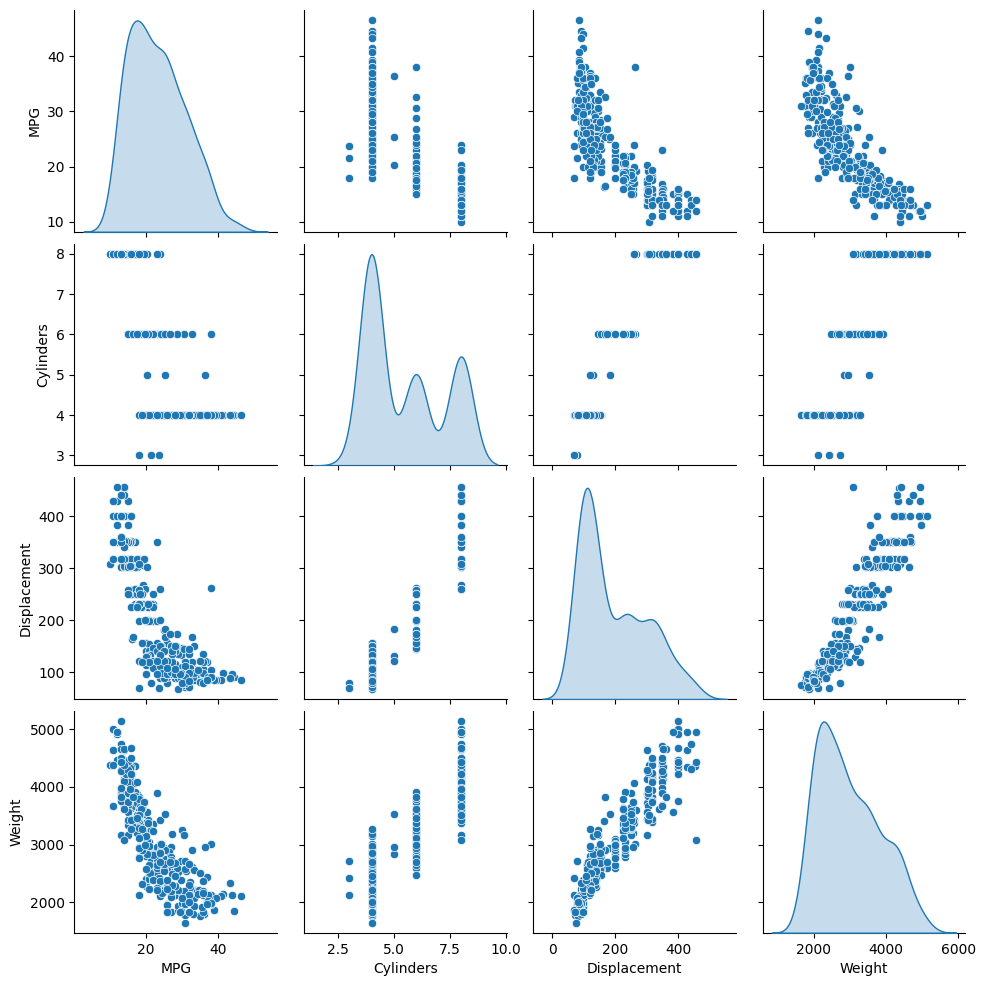
학습셋에서 얻은 칼럼 쌍의 결합 분포들을 빠르게 보겠습니다.
sns.pairplot(train_dataset[["MPG", "Cylinders", "Displacement", "Weight"]], diag_kind="kde")
<seaborn.axisgrid.PairGrid at 0x7f6243f08630>

대략적인 통계를 보겠습니다:
train_stats = train_dataset.describe()
train_stats.pop("MPG")
train_stats = train_stats.transpose()
train_stats
특징에 따라 라벨 나누기
목표 값 또는 라벨을 or “label”, from the features. This label is the value that you will train the model to predict.
train_labels = train_dataset.pop('MPG')
test_labels = test_dataset.pop('MPG')
데이터 정규화(Normalize)
train_stats 블록을 다시 보겠습니다. 그리고 어떻게 각 피쳐의 범주가 어떻게 다른지 유의해 보겠습니다. 피쳐 정규화의 좋은 예제는 다른 scales과 ranges를 사용하는 것 입니다. 비록 모델은 피쳐 정규화(feature normalization) 어이 수렴(converge)합니다. 학습을 어렵게 하고, 모델이 입력 유닛에 의존하게 합니다.
유의: 의도적으로 학습 셋에 대해 이러한 통계를 생성하며, 이러한 통계는 테스트 셋의 정규화에도 사용합니다. 테스트 데이터셋이 학습 셋의 모델 분포와 동일 하도록 할 필요가 있습니다.
def norm(x):
  return (x - train_stats['mean']) / train_stats['std']
normed_train_data = norm(train_dataset)
normed_test_data = norm(test_dataset)
정규화된 데이터는 모델 학습에 사용할것 입니다.
유의: The statistics used to normalize the inputs here (mean and standard deviation) need to be applied to any other data that is fed to the model, along with the one-hot encoding that we did earlier. That includes the test set as well as live data when the model is used in production.
모델 빌드
모델을 빌드하겠습니다. 여기서 Sequential 모델을 사용하겠습니다. 두 은닉 밀집 레이어(densely connected hidden layers)와 단일, 연속 값을 반환하는 출력 레이어(output layer)로 구성됩니다. build_model 은 빌드 과정을 래핑합니다. 두번째 모델을 나중에 만들것입니다.
def build_model():
  model = keras.Sequential([
    layers.Dense(64, activation='relu', input_shape=[len(train_dataset.keys())]),
    layers.Dense(64, activation='relu'),
    layers.Dense(1)
  ])

  optimizer = tf.keras.optimizers.RMSprop(0.001)

  model.compile(loss='mse',
                optimizer=optimizer,
                metrics=['mae', 'mse'])
  return model
model = build_model()
모델 검사
.summary 메서드를 사용해 간단한 모델 설명을 출력하겠습니다.
model.summary()
Model: "sequential"
_________________________________________________________________
Layer (type)                 Output Shape              Param #
=================================================================
dense (Dense)                (None, 64)                640
_________________________________________________________________
dense_1 (Dense)              (None, 64)                4160
_________________________________________________________________
dense_2 (Dense)              (None, 1)                 65
=================================================================
Total params: 4,865
Trainable params: 4,865
Non-trainable params: 0
_________________________________________________________________
하나의 배치에 쓰일 10개의 예제를 학습셋으로 부터 얻고 model.predict 을 호출하겠습니다.
example_batch = normed_train_data[:10]
example_result = model.predict(example_batch)
example_result
WARNING:tensorflow:Falling back from v2 loop because of error: Failed to find data adapter that can handle input: <class 'pandas.core.frame.DataFrame'>, <class 'NoneType'>

array([[ 0.24059168],
       [ 0.12669177],
       [ 0.03966667],
       [ 0.24358979],
       [-0.08104186],
       [-0.011035  ],
       [-0.03190574],
       [-0.50567085],
       [ 0.05759671],
       [-0.02087457]], dtype=float32)
동작 하는 것처럼 보입니다. 그리고 예측된 모양과 타입을 결과로 생성합니다.
모델 학습
Train the model for 1000 epochs, and record the training and validation accuracy in the history object.
EPOCHS = 1000history = model.fit( normed_train_data, train_labels, epochs=EPOCHS, validation_split = 0.2, verbose=0, callbacks=[tfdocs.modeling.EpochDots()])
WARNING:tensorflow:Falling back from v2 loop because of error: Failed to find data adapter that can handle input: <class 'pandas.core.frame.DataFrame'>, <class 'NoneType'>

Epoch: 0, loss:566.3408,  mae:22.5228,  mse:566.3408,  val_loss:556.7298,  val_mae:22.2780,  val_mse:556.7298,
....................................................................................................
Epoch: 100, loss:6.1538,  mae:1.7338,  mse:6.1538,  val_loss:8.9099,  val_mae:2.2968,  val_mse:8.9099,
....................................................................................................
Epoch: 200, loss:5.3395,  mae:1.6228,  mse:5.3395,  val_loss:9.5529,  val_mae:2.3983,  val_mse:9.5529,
....................................................................................................
Epoch: 300, loss:4.7902,  mae:1.4802,  mse:4.7902,  val_loss:9.5075,  val_mae:2.3247,  val_mse:9.5075,
....................................................................................................
Epoch: 400, loss:4.5003,  mae:1.4805,  mse:4.5003,  val_loss:10.0866,  val_mae:2.3732,  val_mse:10.0866,
....................................................................................................
Epoch: 500, loss:3.9125,  mae:1.3605,  mse:3.9125,  val_loss:9.8799,  val_mae:2.3610,  val_mse:9.8799,
....................................................................................................
Epoch: 600, loss:3.7809,  mae:1.3178,  mse:3.7809,  val_loss:9.6062,  val_mae:2.3195,  val_mse:9.6062,
....................................................................................................
Epoch: 700, loss:3.6050,  mae:1.2979,  mse:3.6050,  val_loss:9.5591,  val_mae:2.3370,  val_mse:9.5591,
....................................................................................................
Epoch: 800, loss:3.0788,  mae:1.1724,  mse:3.0788,  val_loss:9.7324,  val_mae:2.3716,  val_mse:9.7324,
....................................................................................................
Epoch: 900, loss:2.9253,  mae:1.1366,  mse:2.9253,  val_loss:9.5585,  val_mae:2.3179,  val_mse:9.5585,
....................................................................................................
Visualize the model's training progress using the stats stored in the history object.
hist = pd.DataFrame(history.history)
hist['epoch'] = history.epoch
hist.tail()
plotter = tfdocs.plots.HistoryPlotter(smoothing_std=2)
plotter.plot({'Basic': history}, metric = "mae")
plt.ylim([0, 10])
plt.ylabel('MAE [MPG]')
Text(0, 0.5, 'MAE [MPG]')

plotter.plot({'Basic': history}, metric = "mse")
plt.ylim([0, 20])
plt.ylabel('MSE [MPG^2]')
Text(0, 0.5, 'MSE [MPG^2]')

This graph shows little improvement, or even degradation in the validation error after about 100 epochs. Let's update the model.fit call to automatically stop training when the validation score doesn't improve. We'll use an EarlyStopping callback that tests a training condition for every epoch. If a set amount of epochs elapses without showing improvement, then automatically stop the training.
You can learn more about this callback here.
model = build_model()

# The patience parameter is the amount of epochs to check for improvement
early_stop = keras.callbacks.EarlyStopping(monitor='val_loss', patience=10)

early_history = model.fit(normed_train_data, train_labels,
                    epochs=EPOCHS, validation_split = 0.2, verbose=0,
                    callbacks=[early_stop, tfdocs.modeling.EpochDots()])
WARNING:tensorflow:Falling back from v2 loop because of error: Failed to find data adapter that can handle input: <class 'pandas.core.frame.DataFrame'>, <class 'NoneType'>

Epoch: 0, loss:574.2276,  mae:22.7522,  mse:574.2276,  val_loss:569.7690,  val_mae:22.6469,  val_mse:569.7690,
.......................................................
plotter.plot({'Early Stopping': early_history}, metric = "mae")
plt.ylim([0, 10])
plt.ylabel('MAE [MPG]')
Text(0, 0.5, 'MAE [MPG]')

The graph shows that on the validation set, the average error is usually around +/- 2 MPG. Is this good? We'll leave that decision up to you.
Let's see how well the model generalizes by using the test set, which we did not use when training the model. This tells us how well we can expect the model to predict when we use it in the real world.
loss, mae, mse = model.evaluate(normed_test_data, test_labels, verbose=2)

print("Testing set Mean Abs Error: {:5.2f} MPG".format(mae))
WARNING:tensorflow:Falling back from v2 loop because of error: Failed to find data adapter that can handle input: <class 'pandas.core.frame.DataFrame'>, <class 'NoneType'>
78/78 - 0s - loss: 6.0765 - mae: 1.9287 - mse: 6.0765
Testing set Mean Abs Error:  1.93 MPG
예측 만들기
마침내 학습 셋을 이용해 MPG 값을 예측해 보겠습니다.
test_predictions = model.predict(normed_test_data).flatten()

a = plt.axes(aspect='equal')
plt.scatter(test_labels, test_predictions)
plt.xlabel('True Values [MPG]')
plt.ylabel('Predictions [MPG]')
lims = [0, 50]
plt.xlim(lims)
plt.ylim(lims)
_ = plt.plot(lims, lims)
WARNING:tensorflow:Falling back from v2 loop because of error: Failed to find data adapter that can handle input: ,

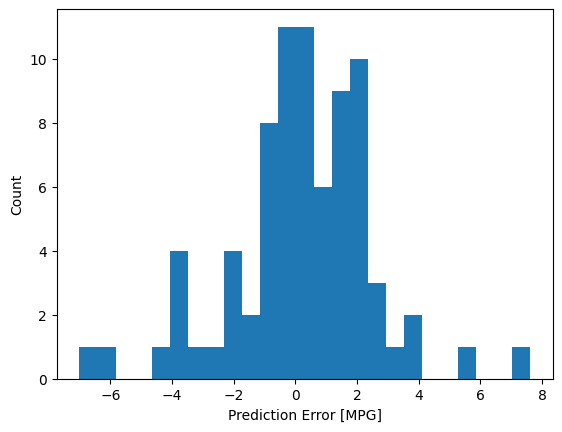
우리 모ㄷ을 꽤 합리적인 예측 결과를 보입니다. 에러 분포를 살펴 보겠습니다.
error = test_predictions - test_labels
plt.hist(error, bins = 25)
plt.xlabel("Prediction Error [MPG]")
_ = plt.ylabel("Count")

가우시안은 아니지만 샘플 수가 적어 예측 가능합니다.
Conclusion
이 노트북은 몇개의 회귀 문제를 다루는 기술을 소개했습니다.
- Mean Squared Error (MSE)는 회귀 문제에서 사용되는 common loss function입니다. (loss functions 은 분류 문제에 사용됨).
- Similarly, evaluation metrics used for regression differ from classification. A common regression metric is Mean Absolute Error (MAE).
- When numeric input data features have values with different ranges, each feature should be scaled independently to the same range.
- If there is not much training data, one technique is to prefer a small network with few hidden layers to avoid overfitting.
- Early stopping is a useful technique to prevent overfitting.